Saturated loose sand under cyclic shaking can lose its strength almost instantaneously — pore pressure rises until effective stress vanishes, and the soil behaves as a heavy fluid. The 1964 Niigata and Alaska earthquakes made this dramatically visible; Seed and Idriss codified the "simplified procedure" in 1971; NCEER (Youd et al. 2001) refined it; and Idriss & Boulanger updated it in 2008.
All three procedures share the same five steps. GeoEq makes each step one function call. Here is the whole pipeline.
Try it — shake the ground yourself
A cartoon house sits on saturated sand. Crank the earthquake magnitude,
peak ground acceleration, soil density (N1)60,cs,
and depth — the soil grains will rattle, water will rise, and the house
will tilt as soon as the factor of safety drops below 1. All numbers
update live using the same NCEER formulas as
ge.liquefaction_fos().
The five-step procedure
- Compute the depth reduction factor rd — how the cyclic shear stress attenuates with depth.
- Compute the cyclic stress ratio CSR — how much shaking the earthquake delivers.
- Compute the cyclic resistance ratio CRR — how much shaking the soil can take.
- Compute the magnitude scaling factor MSF — adjusts CRR for non-7.5 earthquakes.
- Compute FSL = CRR · MSF · Kσ · Kα / CSR. If FSL < 1, liquefaction is predicted.
Step 1 — Depth reduction rd
The simplest form (Liao & Whitman 1986) is bilinear in z. The NCEER-recommended Idriss (1999) form is magnitude-dependent. GeoEq has both:
import geoeq as ge

ge.depth_reduction(z=6, method="idriss_1999", Mw=7.0)
# 0.971
Step 2 — Cyclic Stress Ratio (CSR)
csr = ge.liquefaction_csr(
    amax=0.25,        # PGA as fraction of g
    sigma_v=120,
    sigma_v_eff=70,
    z=6, Mw=7.0,
)
# {'CSR': 0.226, 'rd': 0.971, 'amax_g': 0.25}
Step 3 — Cyclic Resistance Ratio (CRR)
Four families. Pick by what you have measured:
# NCEER simplified — SPT (Youd et al. 2001), the most widely cited
ge.liquefaction_crr(N160cs=12, method="youd_2001")

# Updated SPT (Idriss & Boulanger 2008)
ge.liquefaction_crr(N160cs=15, method="idriss_boulanger_2008")

# Updated CPT (Idriss & Boulanger 2008)
ge.liquefaction_crr(qc1Ncs=100, method="idriss_boulanger_2008_cpt")

# Vs-based (Andrus & Stokoe 2000)
ge.liquefaction_crr(Vs1=150, FC=10, method="andrus_stokoe_2000")
Step 4 — Magnitude Scaling Factor (MSF)
# Three methods; Idriss (1999) is the NCEER-recommended default
ge.magnitude_scaling_factor(Mw=7.0, method="idriss_1999")
ge.magnitude_scaling_factor(Mw=7.0, method="nceer")
ge.magnitude_scaling_factor(Mw=7.0, method="boulanger_idriss_2014")
Step 5 — Factor of safety
fs = ge.liquefaction_fos(
    CSR=csr["CSR"], CRR=0.12, Mw=7.0,
    K_sigma=1.0, K_alpha=1.0,
)
# {'FS': 0.69, 'liquefies': True, 'MSF': 1.19, ...}
What FS < 1 actually means
FSL < 1 means liquefaction is predicted under the design earthquake. It does not say how much ground deformation follows — that is a separate analysis (Tokimatsu & Seed 1987 settlement, Bray & Travasarou 2007 displacement).
Engineering response usually pairs a triggering FS with a deformation estimate. If FS > 1.3, the site is generally considered safe; if FS < 1.0, ground improvement (densification, drainage wells, soil mixing) is typically required for a critical structure.
Visualising on the triggering chart
Plot the CRR curves with your field data overlaid, colour-coded by FS:
ge.liquefaction_chart(
    data_N=[8, 12, 15, 18, 22, 25],
    data_CSR=[0.18, 0.22, 0.15, 0.25, 0.12, 0.10],
    data_FS=[0.6, 0.8, 1.0, 0.7, 1.3, 1.5],
    save_as="liq.pdf",
)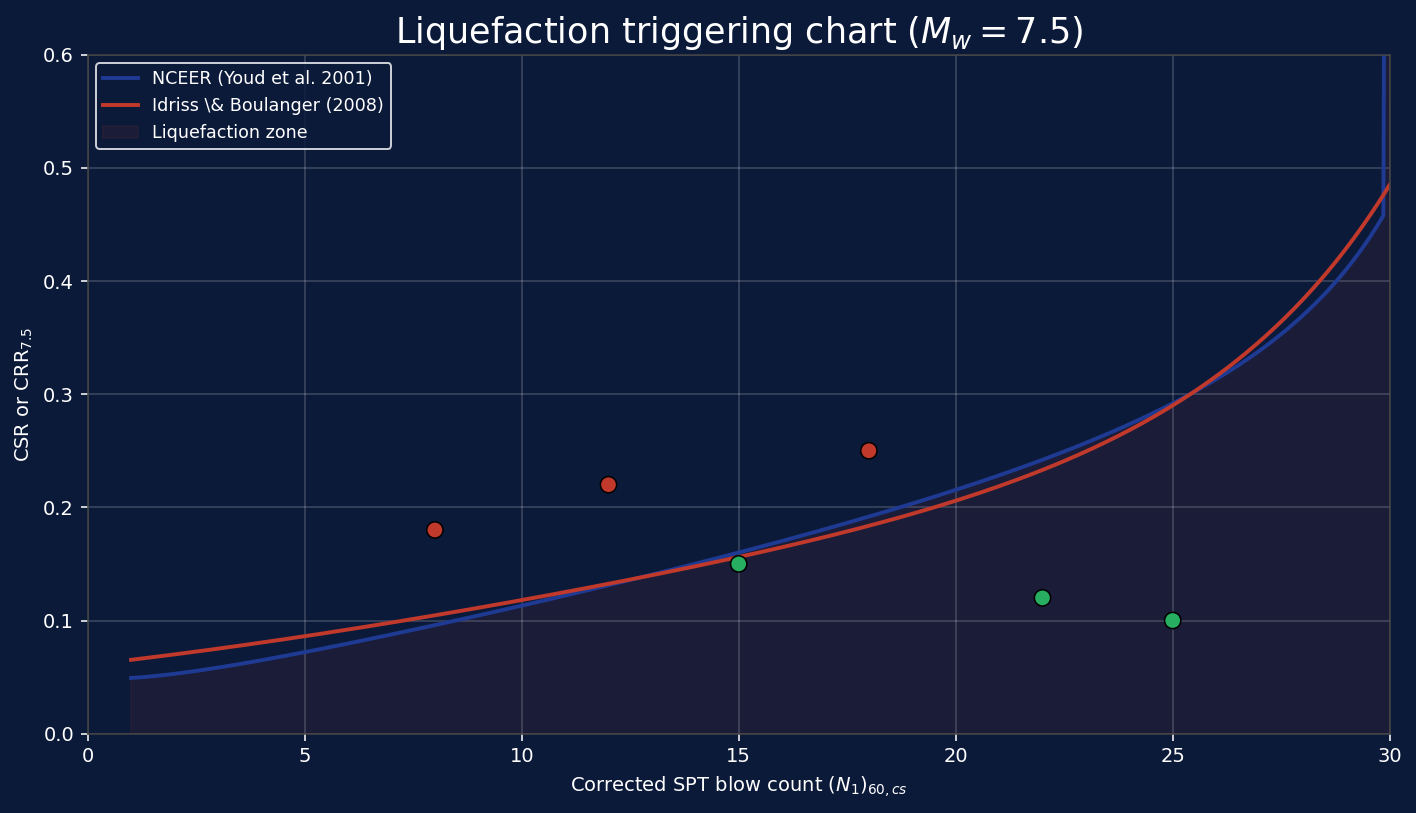
ge.liquefaction_chart().The complete five-line workflow
import geoeq as ge

csr = ge.liquefaction_csr(amax=0.25, sigma_v=120, sigma_v_eff=70, z=6, Mw=7.0)
crr = ge.liquefaction_crr(N160cs=12, method="youd_2001")
fs  = ge.liquefaction_fos(csr["CSR"], crr["CRR"], Mw=7.0)
print(f"FS_L = {fs['FS']:.2f}  ->  {'LIQUEFIES' if fs['liquefies'] else 'safe'}")
# FS_L = 0.58  ->  LIQUEFIES
That is the simplified procedure in its entirety. Spreadsheets typically encode it with dozens of cells and copy-paste-error risk; here it's five readable lines that another engineer can audit at a glance.